|
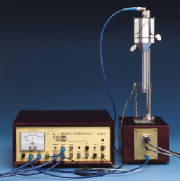
The Sonoluminescence experiments that can be carried
out with the SL100B cover a broad range, but can be classified into two general categories: acoustical and optical. The acoustic
experiments do not necessarily involve trapping a bubble, but rather explore the general acoustic properties of the cell and
the liquid samples. The second type of experiments are all related to characterizing the light emitted from the bubble.
|
|
ACOUSTIC EXPERIMENTS One of the most important topics in classical mechanics is the study of resonant
phenomena and the solution to the wave equation in 3-dimensions, subject to specific boundary conditions. The acoustic wave
equation, with its appropriate solutions provides fertile ground for exploring the many facets of a 3-dimensional system. For
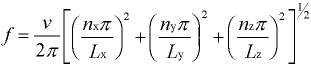
the rectangular crossection cell the eigen frequencies in which the bubbles are trapped are given by:
|
|
where Lx,Ly and
Lz are the length, width and height of
the water filled cell and v is the velocity of sound in water. The hydrophone provides the student with
an appropriate probe to verify the mode structure of the pressure field. That is, it allows the student to locate the pressure
maximums and minimums of the water filled cell. Students can also make various perturbations to the cell geometry and investigate
the phenomena of adiabatic invariance. We can also provide
a cylindrical cell for these experiments. The analysis of the eigen modes for this geometry involves the mathematics of Bessel
functions. The experimental techniques to verify the mathematical predictions are the same as those for the rectangular cell.
|
|
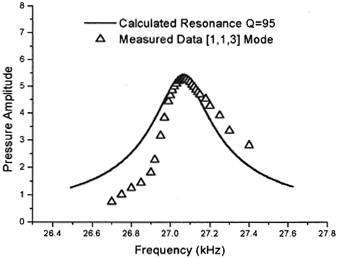
All resonant phenomena involve the storing
of energy in the oscillating system. The quality factor, Q, of the system is the ratio of the energy stored to the energy
dissipated during each cycle. The student can show that Q can be measured by studying the cell's acoustic amplitude response
as a function of the driving frequency. The theoretical curve for the amplitude of a driven, damped, simple harmonic oscillator
as a function of frequency, along with real student data for a SL100B rectangular cell, are shown to the right.
The quality factor Q may also be determined by abruptly terminating the input signal to the control box and observing the
characteristic exponential decay of the cell's acoustic amplitude response.
OPTICAL EXPERIMENTS The variety
of experiments that can be performed on the optical aspects of Sonoluminescence is limited only by the student's imagination
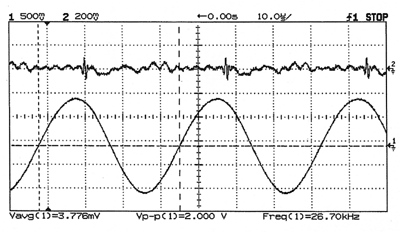
and time. The experimenter's first task is to trap the bubbles at a sonic pressure node. The SL100B electronics give the student
unambiguous signals characteristic of a trapped bubble. To the right
are the signals from the cell's transducer pill when there is no trapped bubble. The upper trace is the pill's signal as it
appears from the filtered high frequency output. (The small high frequency "glitch" that appears on the upper trace
near the maximum of the pill's signal is an artifact of the Ramsey signal generator)
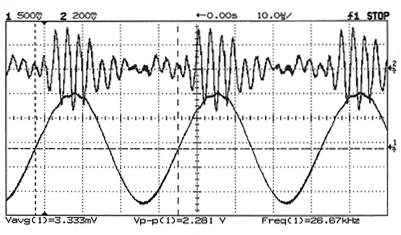
The next data set shows the case when a gas bubble has been trapped. Note the signature
acoustic signal from the collapsing bubble that appears on the upper trace. This is also observable, although less obvious,
on the lower trace. The trapped bubbles were created by a short burst of current through a submerged heater. This causes local
boiling around the heater. The bubbles migrate from the heater until they are trapped at one of the acoustic pressure nodes.
The acoustic amplitude and frequency are adjusted to maximize the bubble trapping. A series of experiments that can be performed quantitatively, with the addition of a photomultiplier tube PMT
(sold as an accessory), involve correlating the light output with drive level, frequency, and temperature. Another series of experiments that can be performed with the addition of a good quality oscilloscope,
is setting an upper limit on the time duration of the SL flash. The student will be amazed to learn that the flash duration
from the SL bubble is in fact many times smaller than the rise times of all but the most expensive PMTs. Measuring this simple
property of the system can be accomplished with a generic PMT and an oscilloscope of sufficiently high bandwidth. The phase
sensitivity near resonance can be explored by observing the phase of the light emission relative to the driving frequency
as the system passes through resonance. Another useful measurement
is that of the light intensity as a function of driving amplitude. By connecting the PMT into the peak detector, a DC voltage
is generated which can be read with any voltmeter. This voltage is proportional to the peak voltage generated by the PMT.
Measuring these characteristics will also enable the first time user of a PMT to gain a general understanding of a PMT's operational
characteristics such as rise time, recover time and dark counts.
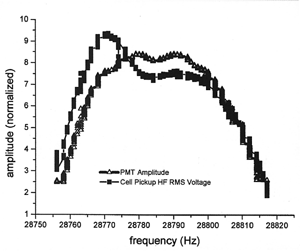
The last figure shows actual student data taken with
a PMT and an AC voltmeter. The driving frequency is changed, passing the system through the mechanical resonance of the cell.
As can be seen on the graph there is a close correlation between the light output and the amplitude of the high frequency
acoustic signal emitted by the bubble just after its collapse.
|